Using R with Phant
Last week on another blog, I showed a way to connect a temperature and humidity sensor to a Beaglebone Black and read it using some Python code that ultimately started with Adafruit.
So to be able to play (a little) AND after complaining about my office temperature last week, I decided to plug this thing in at work and set it up with Phant, the IOT data service from Sparkfun. Â Then I wrote a quick R script to get the JSON file and plot the temperature.
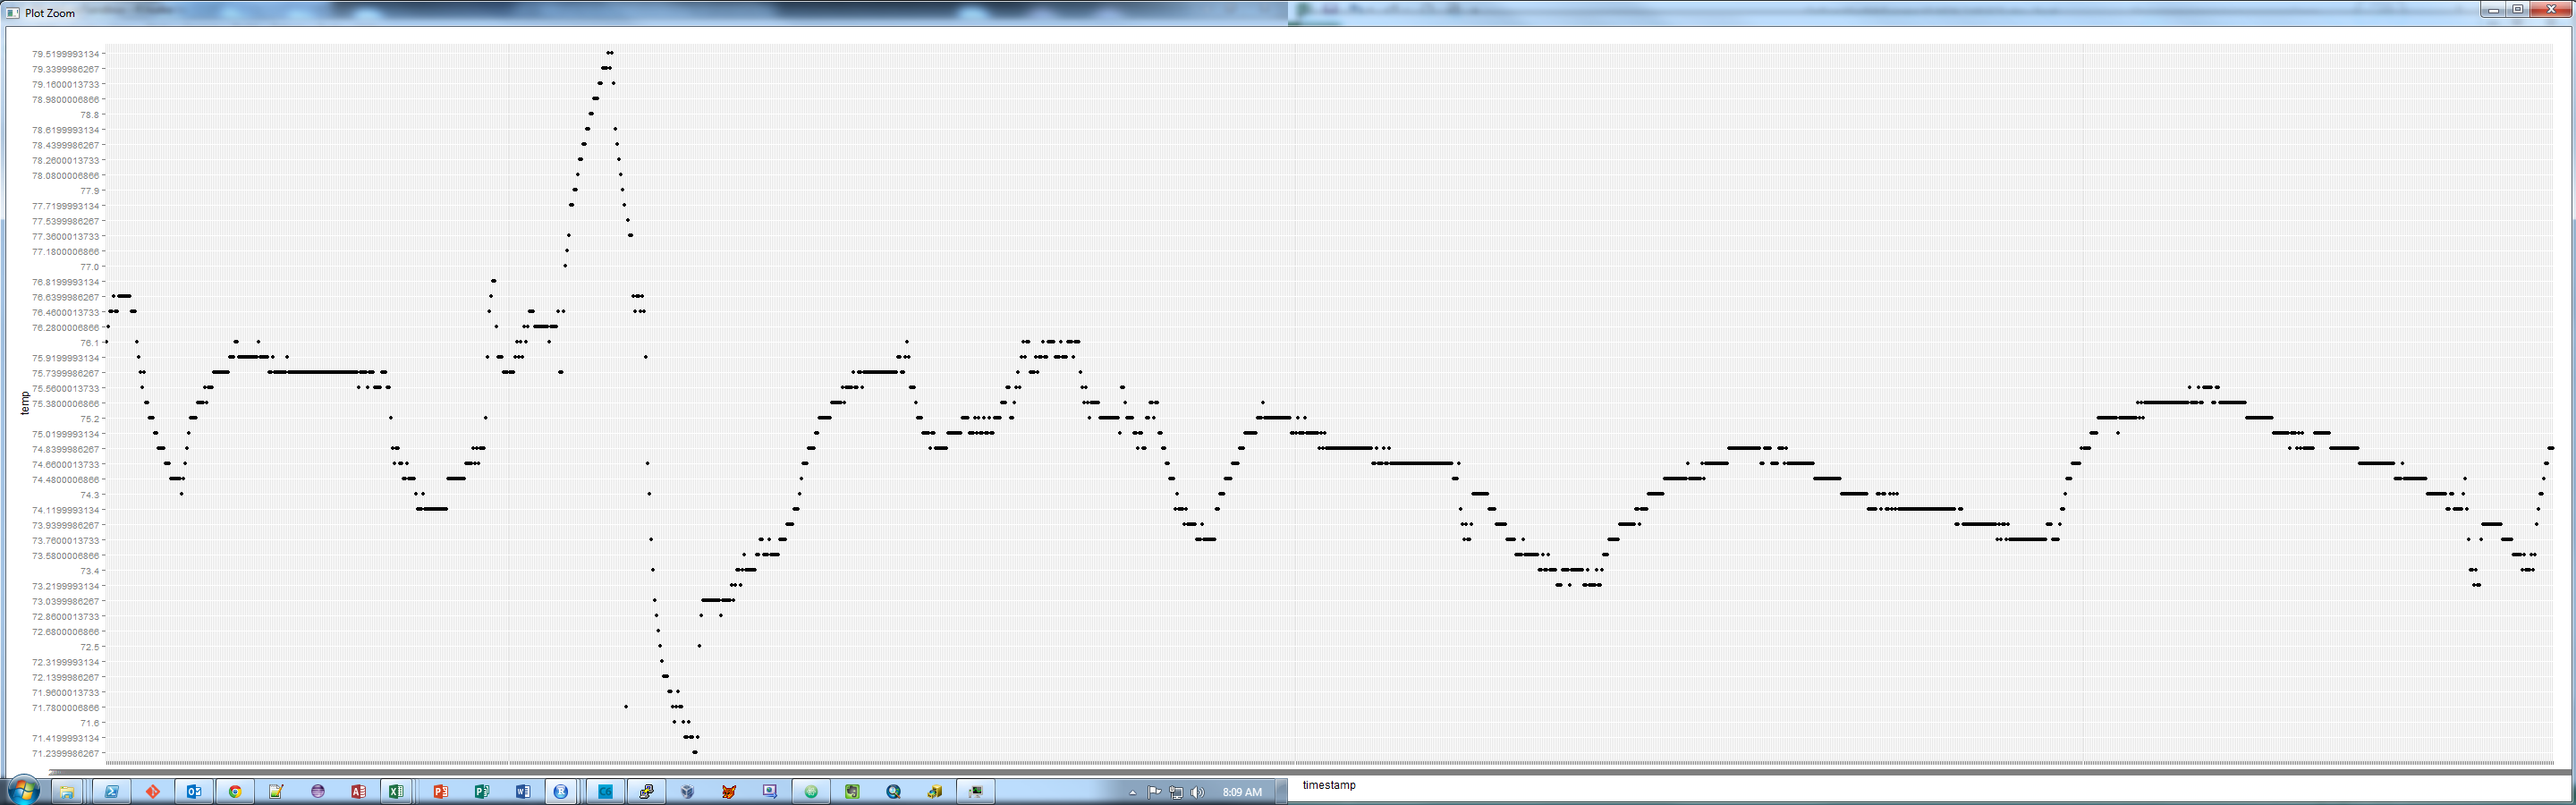
Plot of Temperature
The code is below:
It’s pretty simple, although the plot could use me spending a bit more time on it… and perhaps limiting the data to the last hour or day or something. Â All of that can be done within R pretty easily. Â Also, I did make a file available for anyone that wishes to play (the file is NOT ‘live’, the Phant server is on a different network).
/A
Tags: beaglebone black, JSON, phant, R