R + OMX County Flows
In travel modeling, we use matrices to do things like zone-to-zone trip flows. Â The matrix is like a table, but with an equal number of rows and columns, each representing a location in the model (a traffic analysis zone, like a Census Block Group). Â In the OKI region, we have 2,299 zones, which means there are 5,285,401 cells. Â Too many to look at, and we don’t have reliable data at that level. Â However, we do have semi-reliable data at the county level.
The Open Matrix Format (OMX) is used to get these matrix files out of a proprietary format and into something that can be read by many programs. Â We use this at OKI to move data out of Cube (a proprietary software product) and into R (an open source statistical programming package).
Summarizing a matrix to a county flow table in R is actually pretty easy:
This doesn’t take very long, either. Â Anyone familiar with R can see where the code can be revised to summarize to districts.
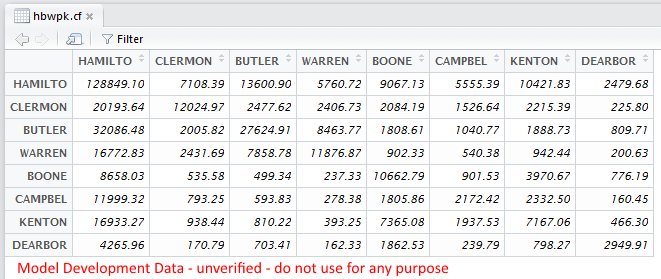
This is what the data looks like. Note that this is not verified data (please do not use it!).
Note: the reason Hamilton, Campbell, and Dearborn county names are cut off is related to a bug in Cube. Â They (Citilabs) are aware of the bug, but it has not been fixed yet.
Tags: county flows, matrix, omx, R