October 20th, 2022
I ended up in a position where I needed to dump a bunch of TransCAD matrix files to OMX files. This is a useful little script that scans all the matrices in a folder (presuming they use the .mtx file extension) and write them out as matrices.
Macro "convertMtx"(Args)
    base_folder = "C:\\your\\path\\here"
    di = GetDirectoryInfo(base_folder + "\\" + folders[fi] + "\\*.mtx", "File")
    for i = 1 to di.length do
        m = OpenMatrix(base_folder + "\\" + folders[fi] + "\\" + di[i][1], )
        matrix_info = GetMatrixInfo(m)
        parts = SplitPath(base_folder + "\\" + folders[fi] + "\\" + di[i][1])
        omx_filename = parts[1] + parts[2] + parts[3] + ".omx"
        mc = CreateMatrixCurrency(m,matrix_info[6].Tables[1],,, )
        new_mat = CopyMatrix(mc, {{"File Name", omx_filename},{"OMX", "True"}})

    end
endMacro
I’m not sure if there is a better way to do this, but this works well enough once compiled and run in TransCAD 9.
April 26th, 2016
From time to time, it makes sense to not re-invent the wheel by building something in R that is already available in another program, like Cube Voyager.
This is incredibly easy:
system("voyager.exe script.S /Start /CloseWhenDone")
That’s it! Â BUT…
If you want the output from a matrix available to R, the last line of your Cube script should include something like:
*cube2omxw output.mat
This will convert the output matrix to an omx file. Â The star runs it from the command prompt.
Important requirements: voyager.exe and cube2omxw.exe must be in your path.
October 23rd, 2015
I am happy to announce that there is now a Ruby API for OMX. This is a read-only API that supports a few ways of reading a matrix, returning an array of J for a given I, an array of I for a given J, and returning the value at a matrix address.
More documentation is available on Github (including the all-important install instructions).
Let me know if you have any questions. Post issues and bugs to the Github issues tracker.
The motivation behind yet-another-API, Ruby seems (operative word!!!) that it handles being a web-based API better than a lot of other languages. I’ve built a few just to test things out – for example, I built a versioned API that responds with random quotes from Yogi Berra… And please don’t build that in to anything, I have the free Heroku plan, so that may disappear at a random time!  Aside from the time that it took to adapt my mess of Voyager+Java+C+++Python(GRRR!)+Basic syntax to Ruby, it wasn’t at all difficult and it is incredibly easy to add another API version.  I would like to have a semi-live map of skims that I can click on a zone and see colors for the selected attribute/matrix (e.g. travel time).
October 8th, 2015
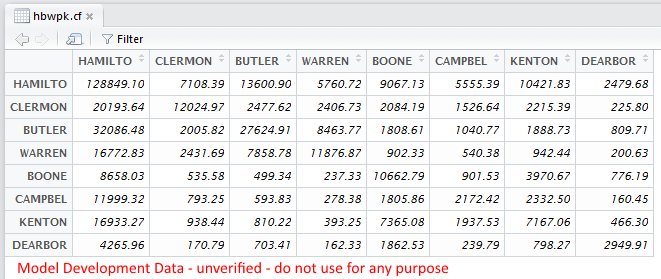
In travel modeling, we use matrices to do things like zone-to-zone trip flows. Â The matrix is like a table, but with an equal number of rows and columns, each representing a location in the model (a traffic analysis zone, like a Census Block Group). Â In the OKI region, we have 2,299 zones, which means there are 5,285,401 cells. Â Too many to look at, and we don’t have reliable data at that level. Â However, we do have semi-reliable data at the county level.
The Open Matrix Format (OMX) is used to get these matrix files out of a proprietary format and into something that can be read by many programs. Â We use this at OKI to move data out of Cube (a proprietary software product) and into R (an open source statistical programming package).
Summarizing a matrix to a county flow table in R is actually pretty easy:
This doesn’t take very long, either. Â Anyone familiar with R can see where the code can be revised to summarize to districts.

This is what the data looks like. Note that this is not verified data (please do not use it!).
Note: the reason Hamilton, Campbell, and Dearborn county names are cut off is related to a bug in Cube. Â They (Citilabs) are aware of the bug, but it has not been fixed yet.
May 8th, 2015
If you don’t follow me on twitter or the Open Model Data site, you may have missed that Cube 6.4 makes some DLL changes that rendered the prior version of the Cube2OMX converter unusable. I jumped in (partly because I installed Cube 6.4) and fixed the problem. You can get the source or a binary on Github.
I did this because sending matrices to DBF files means that you’ll have a 500 MB DBF for a matrix that’s 3200+ zones. Normal R routines chug on it. On the contrary, OMX files are around 10% of that size (60 MB) and R can read them quite quickly – in a matter of seconds instead of minutes.
So the first thing I wanted to do in R with OMX files is Trip Length Frequency Plots. This isn’t incredibly quick, but it works. The code is below. According to one run in R, it takes around 6 minutes to run (on 3,312 zones). The largest part is the loop in the function, and this could probably be parallelized (is that a word?) using doParallel.
Code below or here…