Illustration of Gravity Model K Factor Effects
While the use of K factors can be very questionable when applied inappropriately, they have been a practice in gravity models for a very long time. Â For some regions where psychological boundaries (e.g. state lines, river crossings, etc.) cause an effect on travel, K factors have been used to correct problems.
I decided to take a closer look on the effects of K factors on a small model in R. Â I fixed the friction factors to 1 to eliminate the effects of the friction factors an just show the effects of K factors.
Using a single constraint gravity model, the effects are quite pronounced:
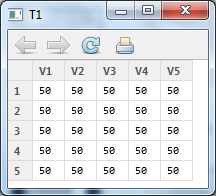
This is the base – all K factors are set to 1
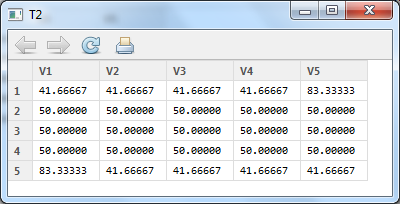
Scenario 2 – K factors for 1-5 and 5-1 are set to 2.
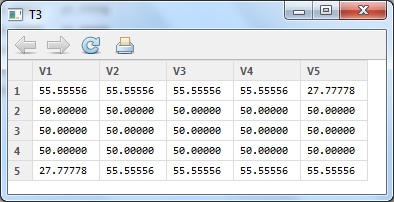
Scenario 3 – the K factors for 1-5 and 5-1 are set to 0.5.
Looking at the three, the two things that stand out is that a K of 2 or 0.5 does not mean that twice or half as many trips will be forecasted to those zones. Â Also, since this is a single-constrained model, the production totals are all the same, but the attraction totals vary. Â The code to run this is on a Github Gist.
This is just a quick example. Â It would change with a doubly-constrained model (which I haven’t attempted yet). Â The details of that may be posted soon.
Tags: distribution, R